#2796: Real Estate Analysis
Permalink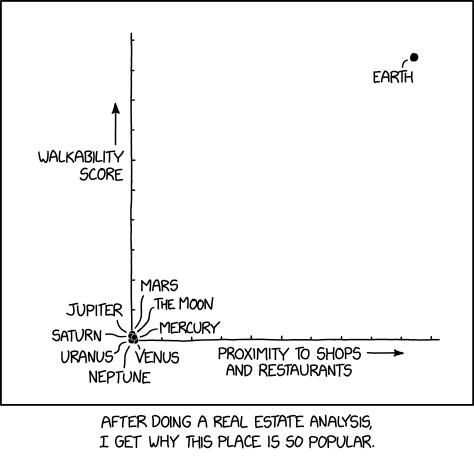
Transcript
[A graph is shown. Both axes have a label with an arrow and 10 visible ticks.]
Y-axis: Walkability score
X-axis: Proximity to shops and restaurants
[Labels of multiple dots at around (0, 0), clockwise:]
Mars, The Moon, Mercury, Venus, Neptune, Uranus, Saturn, Jupiter
[Label of a dot at roughly (9.5, 9.5):]
Earth
[Caption below the panel:]
After doing a real estate analysis, I get why this place is so popular.
(Sourced from explainxkcd.com)
Title text:Mars does get a good score on 'noise levels' and 'scenic views,' but the school district ranking isn't great; the only teacher--the Perseverance rover--is too busy with rock samples to teach more than the occasional weekend class.