#2713: Data Point
Permalink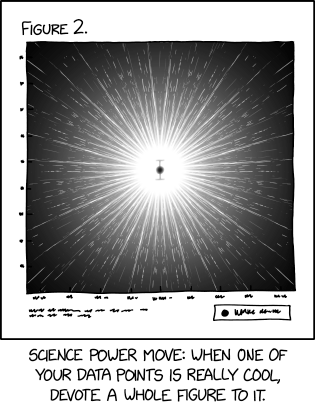
Transcript
[A graph is shown. There are regularly spaced unreadable labels along both axes. In the center there is a single data point with short symmetrical vertical error bars. The graph is dominated by a round white center behind the point from where brilliant white lines emanate out radially in all directions, filling most of the background area, and looking like a star or the sun. Beneath the graph there are two lines of unreadable caption text to the left, next to a rectangular legend box on the right with one dot, indicating the data point, and an unreadable label. Above the graph it is titled:]
Figure 2.
[Caption beneath the panel:]
Science power move: When one of your data points is really cool, devote a whole figure to it.
(Sourced from explainxkcd.com)
Title text:In general you should only include your single best data point in the paper. The rest of the data can go in the supplementary materials.