#2500: Global Temperature Over My Lifetime
Permalink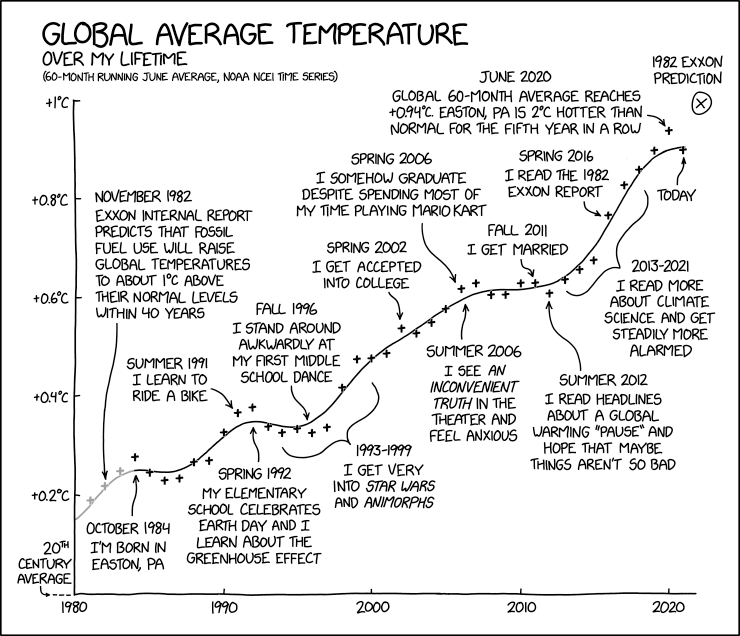
Transcript
[Graph of temperature over time, titled:]
"Global average temperature
Over my lifetime
[smaller text]
(60-month running June average, NOAA NCEI time series)"
[The X axis is in years, going from 1980 to a little after 2020. Each decade is marked.]
[The Y axis is in °C, with the "20th century average" at the bottom, up to +1°C (from the average), labelled every 0.2°C.]
[Certain points and periods on the graph are marked and contain descriptions of events and actions that occurred in Randall's life.]
Exxon International report predicts that fossil fuel use will raise global temperatures to about 1°C above their normal levels within 40 years
I’m born in Easton, PA
I learn to ride a bike
My elementary school celebrates Earth Day and I learn about the greenhouse effect
I get very into Star Wars and Animorphs
I stand around awkwardly at my first middle school dance
I get accepted into college
I somehow graduate despite spending most of my time playing Mario Kart
I see An Inconvenient Truth in the theater and feel anxious
I get married
I read headlines about a global warning “pause” and hope that maybe things aren’t so bad
I read more about climate science and get steadily more alarmed
I read the 1982 Exxon report
Global 60-month average reaches +0.94°C, Easton, PA is 2°C hotter than normal for the fifth year in a row
(no description)
[Large X within a circle] 1982 Exxon Prediction
(Sourced from explainxkcd.com)
Title text:I was really impressed by the accuracy of some of the report's predictions about fossil fuel consumption. Then I realized, oh, right, of course.