#1993: Fatal Crash Rate
Permalink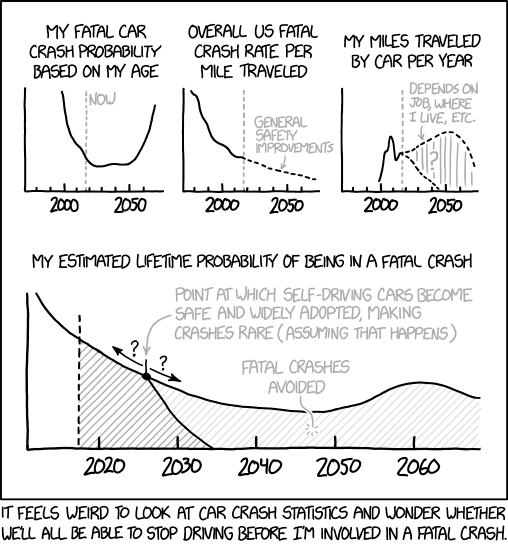
Transcript
[Graphs are shown inside of a panel.]
[Graph 1:]
My fatal car crash probability based on my age
[Label at 2018:]
Now
[Graph 2:]
Overall US fatal crash rate per mile traveled
[Label:]
General safety improvements
[Graph 3:]
My miles traveled by car per year
[Label after 2018:]
Depends on job, where I live, etc.
[Graph 4, below the previous graphs:]
My estimated lifetime probability of being in a fatal car crash
[Label pointing at late-2020s:]
Point at which self-driving cars become safe and widely adopted, making crashes rare (assuming that happens)
[Label pointing at a gray segment after late-2020s:]
Fatal crashes avoided
[Caption below the panel:]
It feels weird to look at car crash statistics and wonder whether we'll all be able to stop driving before I'm involved in a fatal crash.
(Sourced from explainxkcd.com)
Title text:Fixating on this seems unhealty. But in general, the more likely I think a crash is, the less likely one becomes, which is a strange kind of reverse placebo effect.