#3275: Calibration Nobel
Permalink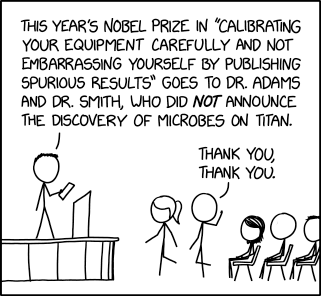
Transcript
[Hairy is standing behind a lectern on a podium, holding a piece of paper and addressing the attendees in front of him. Ponytail and Cueball walk toward the podium and Cueball is waving to the audience. In the audience are Megan, another Cueball, and another Hairy sitting on chairs.]
Hairy: This year's Nobel Prize in "Calibrating your equipment carefully and not embarrassing yourself by publishing spurious results" goes to Dr. Adams and Dr. Smith, who did not announce the discovery of microbes on Titan.
Cueball: Thank you, thank you.
(Sourced from explainxkcd.com)
Title text:We would like to once again apologize to Dr. Jones for last year's mistaken announcement. We should really have double-checked the envelope for this award in particular.